Visualizing electric vehicle station usage.
Spring 2019
Electric Vehicle Data Visualization
I was tasked with taking the client's Electric Vehicle (EV) charging station usage data and creating a comprehensive and informative visualization report. The provider of these stations, ChargePoint, allows this data to be accessed by the client either through a downloadable .CSV or through ChargePoint's API. My role on this project was to interview the client, clean and manipulate the data to fulfill their needs, research API integration, and create a visualization report for their internal use.
After researching different data analytic and information solutions, I decided that Microsoft's Power BI (BI) would suit the client's needs the best. Within BI, I queried the data to get the required and compatible data points for the visuals themselves, but also the data for user interaction and filtration of the visuals.
We decided against setting up a system that would allow the automatic connection between ChargePoint's API and Power BI. Though BI has extensive ways to connect data from databases and REST APIs, ChargePoint uses a SOAP API which presented challenges and additional expenses. In this researching phase, I was able to get data from the API to BI by using two third-party software solutions. However, the extra steps and costs were not worth us to pursue this at the time.
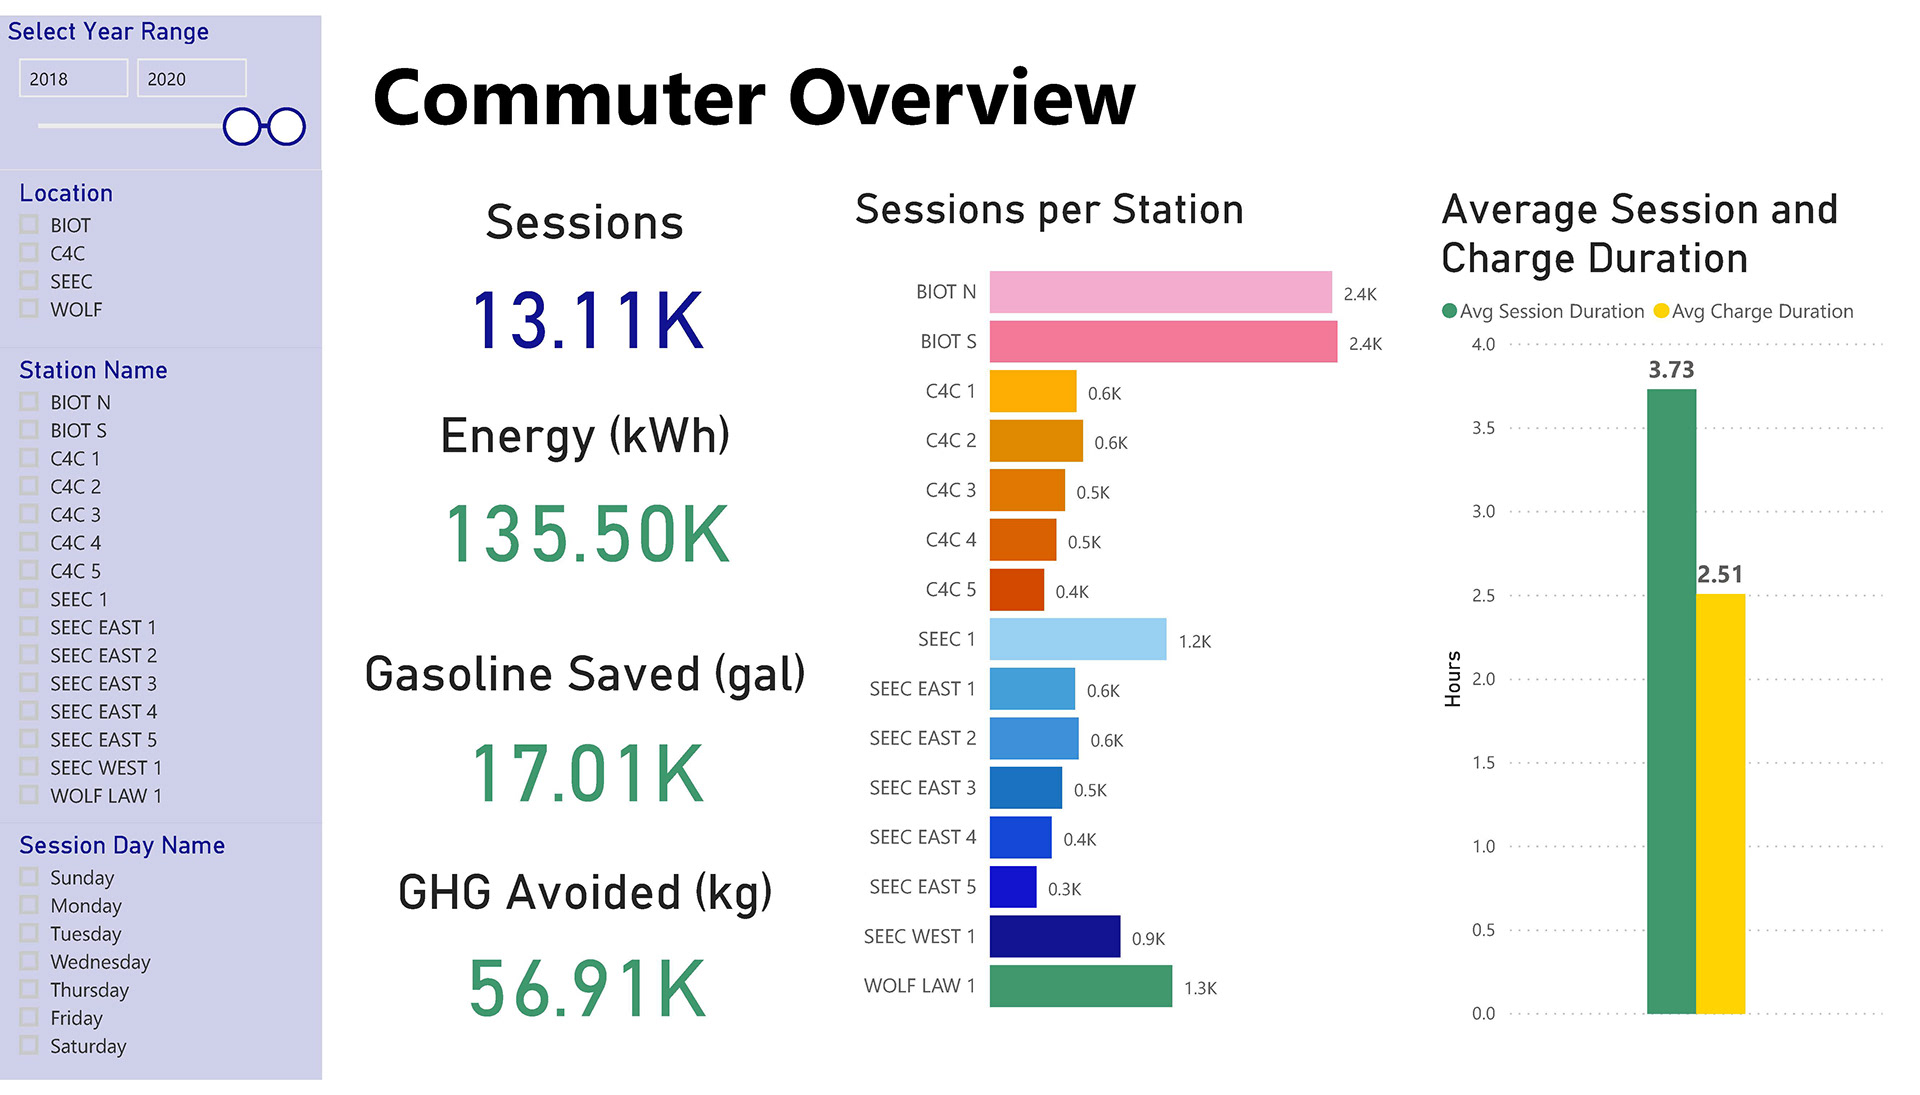
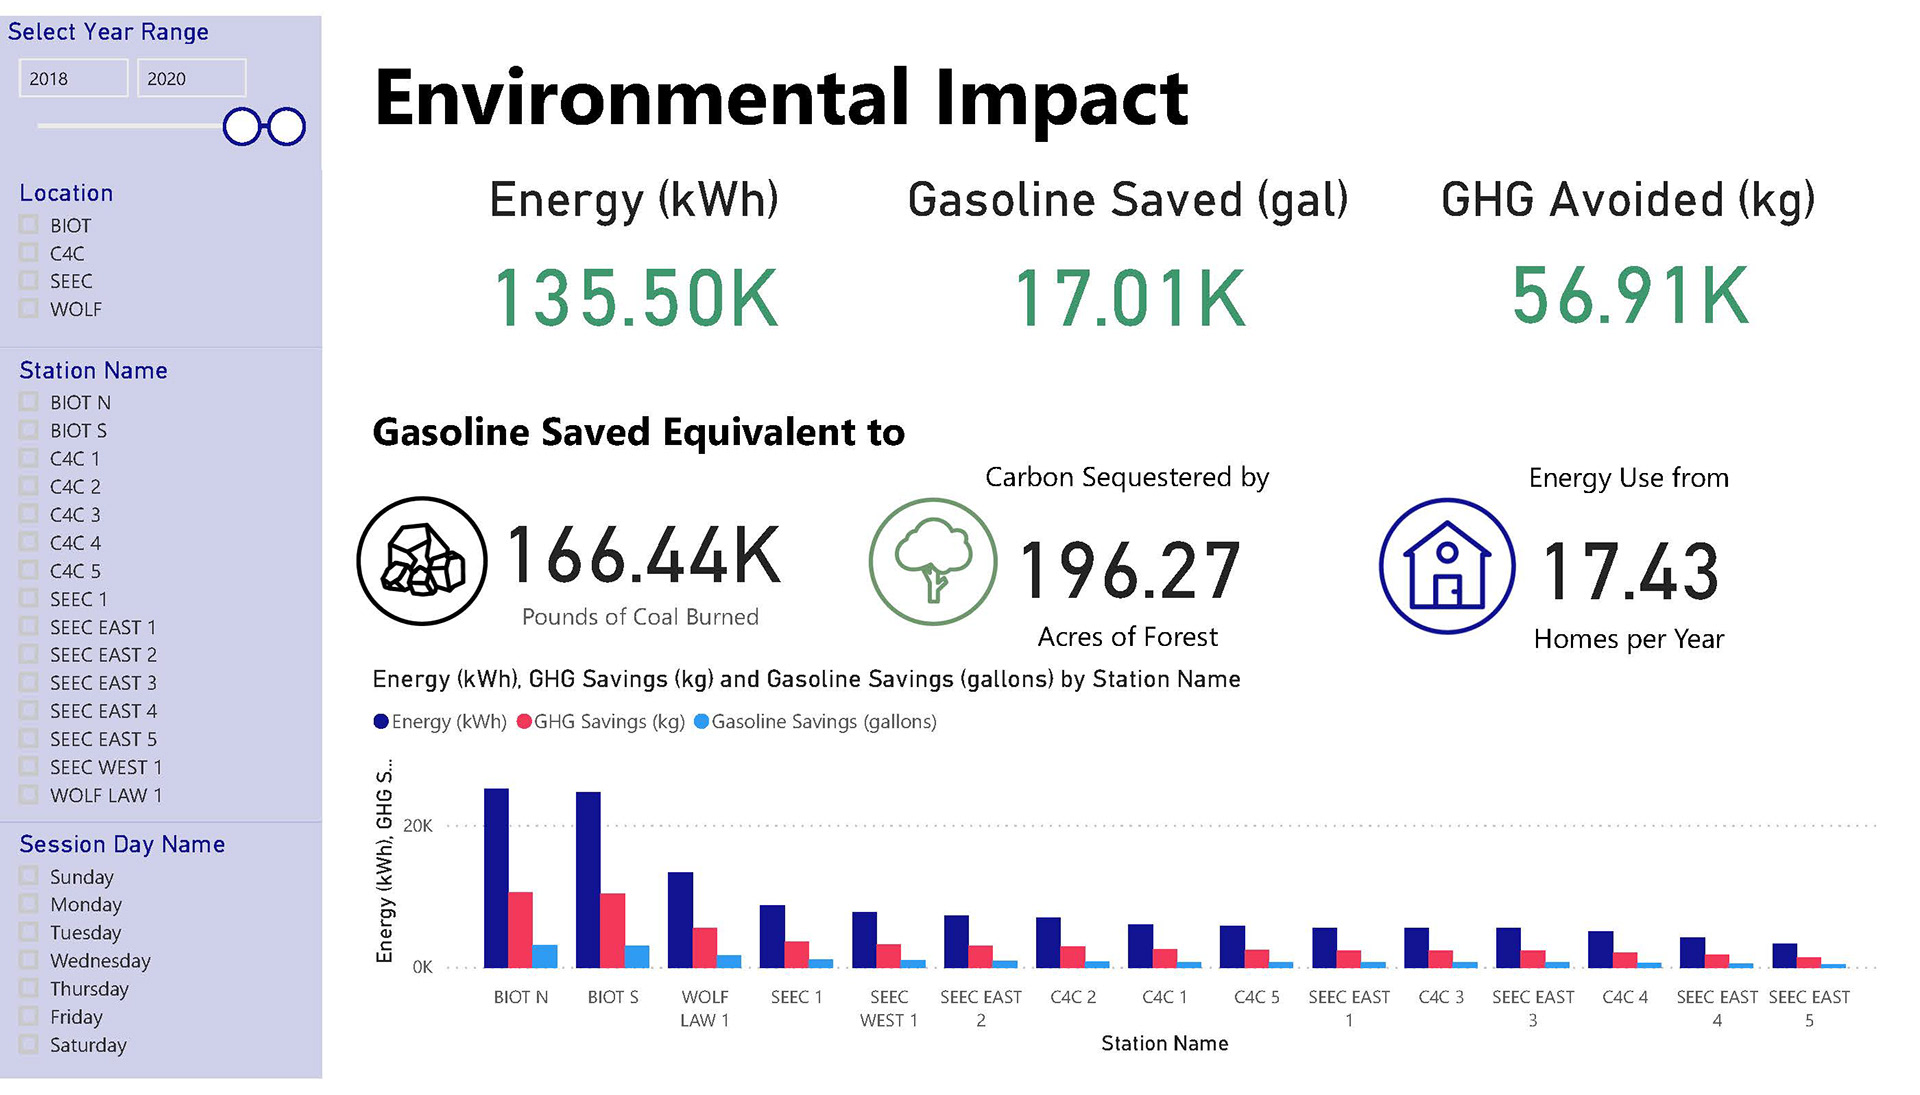
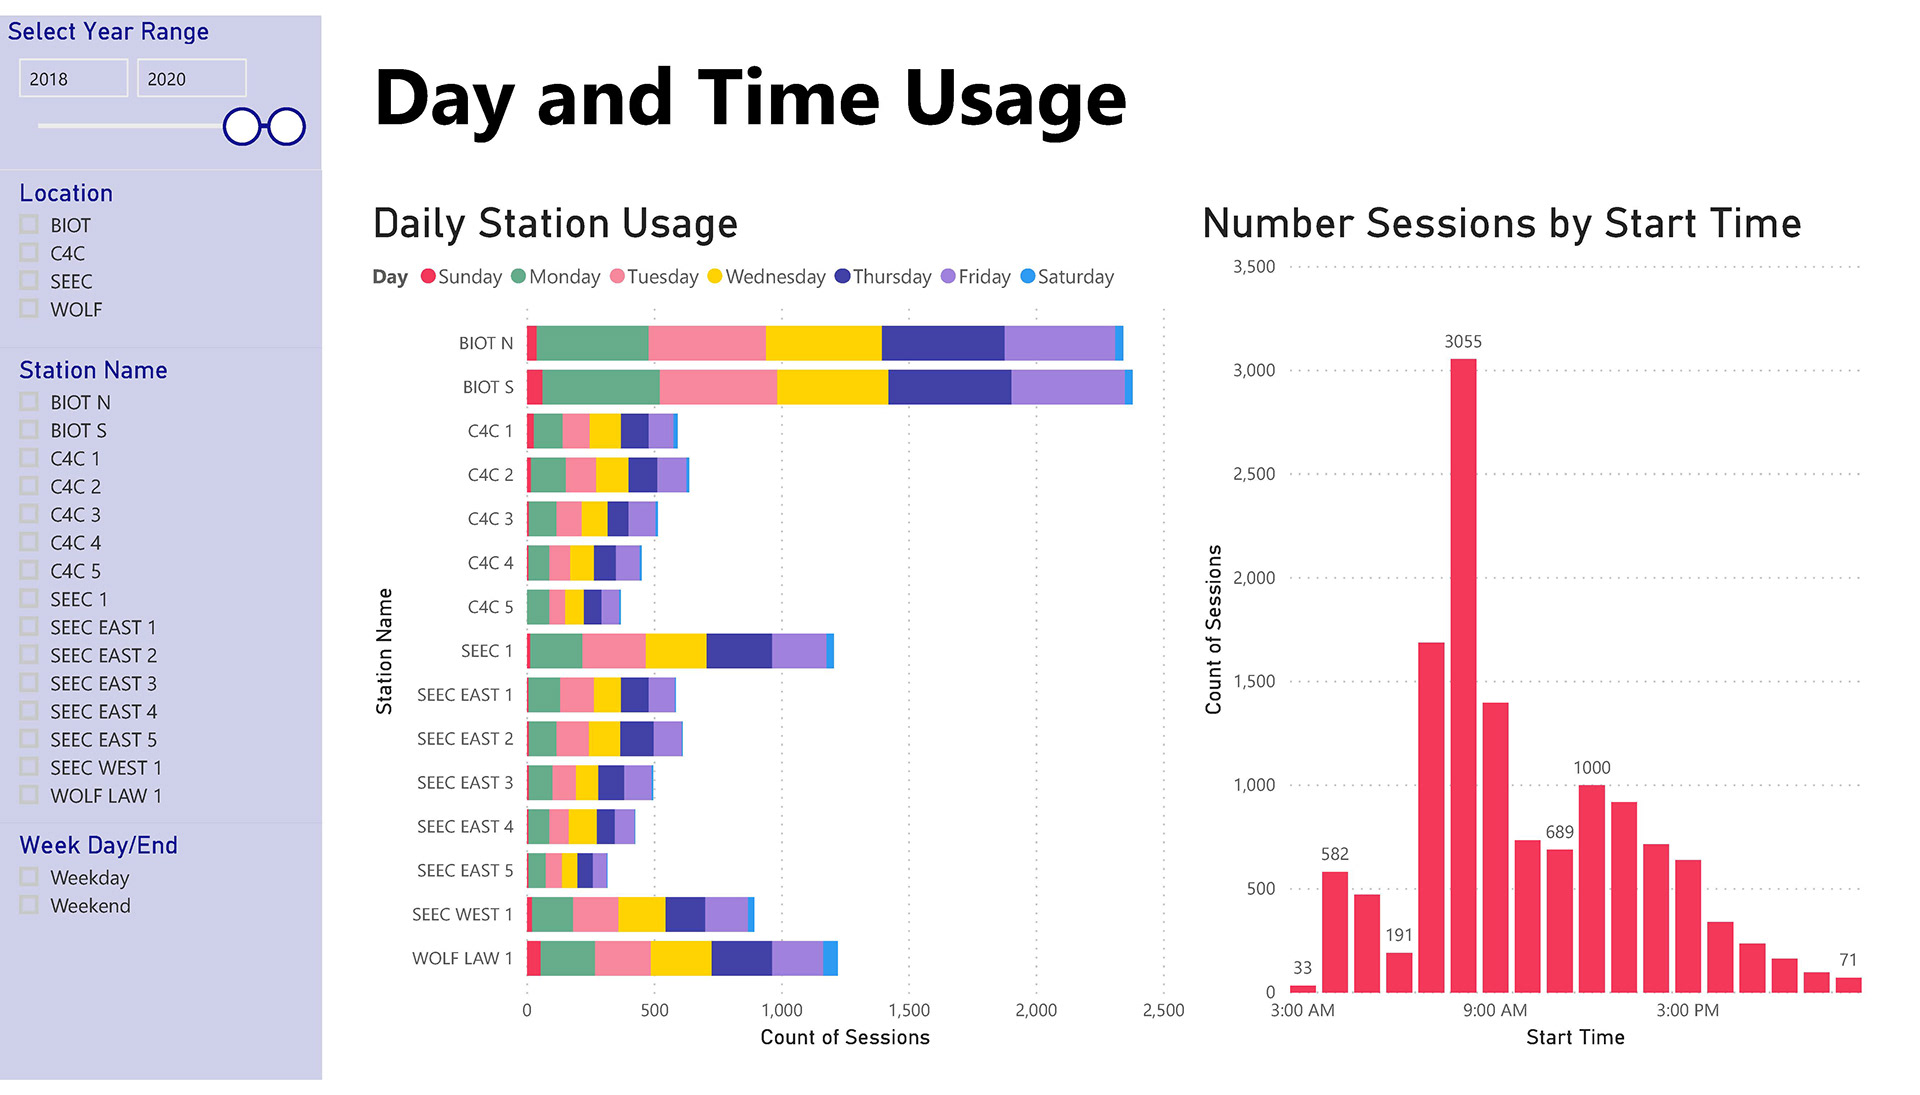
Back in Power BI, I then used this data to create visualizations that would give the client clear insights to station usage such as: average charging time, total GHG and gasoline avoided, the average number of sessions per time of day, geological data, etc. I met with the client on multiple occasions to talk about the progress and visual design of the report. As the project ended, I documented the steps I took in Power BI and in depth reasoning on why we did not implement an API solution.